Explore over 500,000 Images in my personal collection
real images | real history | no AI

|
|
- Code Number:
- UPDD01_011
- Title:
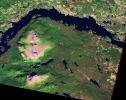
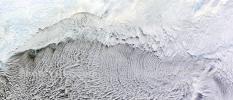
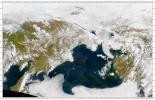
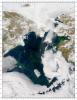
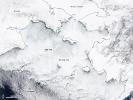
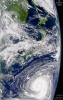
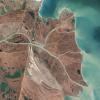
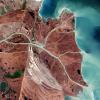
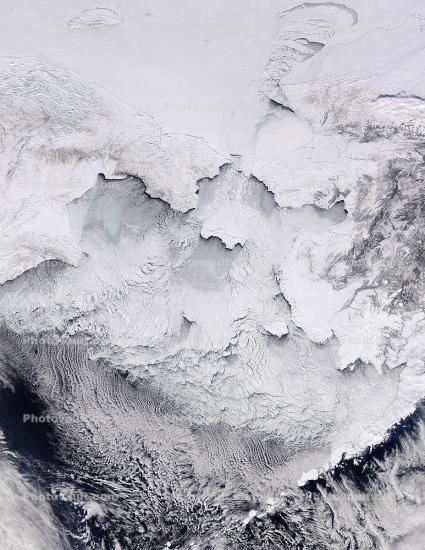
- Sea Ice, Bering Sea, 2012, Climate Change
- For most of the winter of 2011?2012, the Bering Sea has been choking with sea ice. Though ice obviously forms there every year, the extent of the ice cover has been unusually widespread this season. In fact, the past several months have included the second highest ice extent in the satellite record for the Bering Sea region, according to the National Snow and Ice Data Center (NSIDC).
The natural-color image above shows the Bering Sea and the coasts of Alaska and northeastern Russia on March 19, 2012. The image was acquired by the Moderate Resolution Imaging Spectroradiometer (MODIS) on NASA?s Aqua satellite. Black lines mark the coastlines, many of which have ice shelves or frozen bays extending beyond their land borders.
NSIDC reported that ice extent in the Bering Sea for January was 562,000 square kilometers, at least 104,600 square kilometers above the 1979 to 2000 average. Though numbers were not released for February, the pattern persisted through to March 2012.
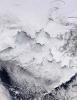
The accumulation of ice this season has largely been fueled by persistent northerly winds blowing from the Arctic Ocean across the Strait. Local weather has been dominated this winter by a low-pressure system?with its counterclockwise circulation?that has brought extensive moisture from the south to coastal and interior Alaska and cold winds down across the sea to the west.
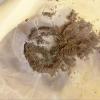
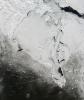
Those winds have pushed ice toward the narrow, shallow strait, where it piles up. Beyond the narrows, those same winds also push cold air and cold surface waters to lower latitudes, allowing the ice to grow farther south than usual. As of March 16, National Weather Service forecasters noted that all of the ice cover in the Bering Sea was first year ice, much of it new and thin.
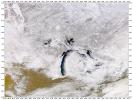
The widespread and persistent ice cover in the Bering Sea has posed significant problems for fisherman and for supply ships in the region. The weather driving the ice has also brought extreme snowfall events to many parts of Alaska this winter.
The Bering stands in stark contrast to the rest of the Arctic ice cap, where sea ice extent was below average in both January and February. Ice cover was down drastically on the Atlantic Ocean side of the Arctic, including the Kara, Barents, and Laptev Seas, where ice-free waters were 4 to 8 degrees Celsius (7 to 14 degrees Fahrenheit) above the norm.
1.
References
2. NASA Earth Observatory (2012, January 22) Sea Ice off Southwestern Alaska.
3. National Snow and Ice Data Center (2012, March 6) February ice extent low in the Barents Sea, high in the Bering Sea.
4. Accessed March 19, 2012. National Weather Service, Anchorage Forecast Office Alaska Sea Ice Forecast. Accessed March 19, 2012.
NASA image by Rob Simmon based on data from Jeff Schmaltz, LANCE/EOSDIS MODIS Rapid Response Team at NASA GSFC. Caption by Mike Carlowicz, with image interpretation by Walt Meier and Ted Scambos, National Snow and Ice Data Center.
Instrument:
Aqua - MODIS - Keywords:
- Image by:
- NASA
- Caption Disclaimer
Royalty Free: Calculate Price